
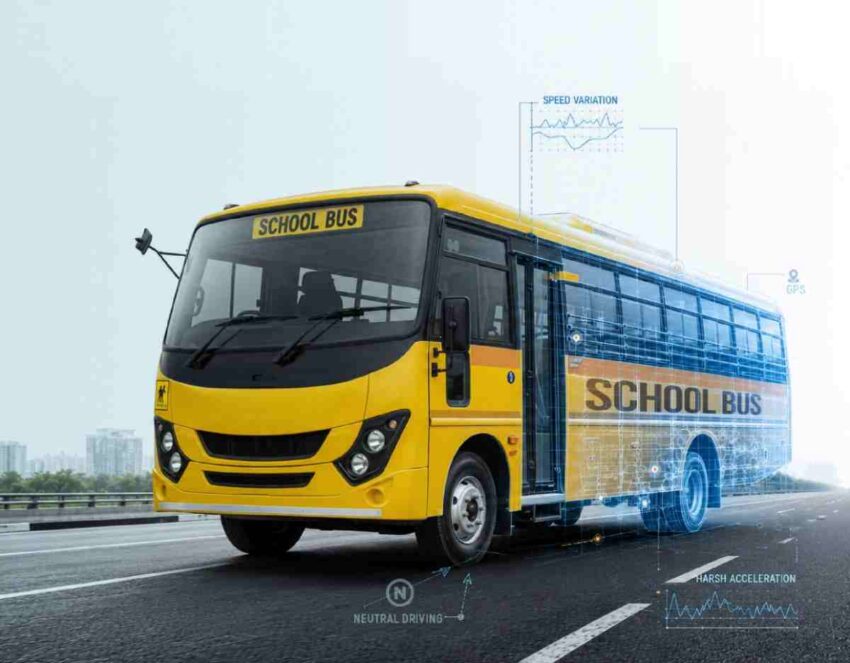
- Delhi emerges as a major concern, with 4 in 5 school buses recording speeding incidents, while Maharashtra recorded a sixfold higher share of harsh acceleration events than the national average
- 116 school buses flagged speeding incidents every 2 to 3 days, with speeds averaging 79 km/h during flagged instances against the prescribed 40 km/h limit
Intangles, a global AI-powered prescriptive analytics company specialising in commercial fleets and mobility analytics domain, released a study on school bus safety in India, revealing that one in five school buses analysed across 61 Indian cities recorded at least one over-speeding incident. The study, which examined driving behaviour across 598 school buses across India, uncovered significant regional variations, with four in five school buses analysed in Delhi recording over-speeding incidents, compared with one in five nationally. Maharashtra also emerged as an area of concern, recording a sixfold higher share of harsh acceleration events than the national average.
The findings are part of Intangles' latest study, Interesting Angles- Episode 2: Beyond the Rulebook, which analysed over 75,000 flagged driving events across 598 school buses over a six-month period in 2026. The study examined four driving behaviours, including over-speeding, hard braking, harsh acceleration and coasting, to assess risks that may not be visible through conventional school bus safety checks. The study also identified 116 school buses that flagged over-speeding incidents every two to three days. During these flagged instances, buses recorded an average speed of approximately 79 km/h, significantly higher than the prescribed limit. The findings highlight the need for continuous monitoring of driving behaviour, over and above the mandatory speed governors and standard GPS tracking systems.
The analysis also compared driving behaviour alerts in school buses versus city buses, revealing substantial differences in the driving behaviour and associated safety
events.
|
Driving Behavior |
School Buses |
City Buses |
Comparative Difference |
|
Harsh acceleration |
4.6% |
1.8% |
4X |
|
Hard braking |
81.5% |
38.9% |
3X |
|
Coasting |
2.9% |
0.4% |
9X |
*Please note: These comparisons reflect the distribution of alerts within each vehicle category rather than the frequency of incidents per journey.
Hard braking emerged as the most prevalent driving behaviour, accounting for 81.5% of all flagged safety events. On average, each school bus recorded 126 flagged events over six months, including approximately 103 hard braking incidents, equivalent to nearly one hard braking event every two school days. The study also identified what it terms the 'Bell Effect', with hard braking incidents rising sharply between 7 AM and 8 AM across geographies, coinciding with the morning school commute. The concentration of these incidents during school opening hours raises questions about the influence of traffic congestion, tight schedules and the pressure to reach school before the bell rings. While the study does not establish a direct cause, the widespread pattern suggests that school transportation safety needs to account for operational pressures alongside individual driving behaviour.
The study further identified notable regional differences in driving behaviour. In Maharashtra, harsh acceleration accounted for 30% of flagged events in the report's regional comparison, six times the national average of 5%. Within the state, Pune recorded a 42% share of harsh acceleration events, compared with 15% in Mumbai. These differences suggest that congestion alone may not explain aggressive acceleration patterns, pointing to the need for closer examination of driver behaviour and operating conditions.
Anup Patil, CEO, Intangles, said, “School bus safety is often measured by whether a vehicle meets prescribed regulations, from speed governors and GPS tracking to onboard safety equipment. But compliance does not necessarily tell us how safely a child is being driven. Our analysis found recurring instances of speeding and hard braking across school buses, with some of these behaviours occurring repeatedly during routine journeys. What is equally important is understanding the conditions in which these incidents occur.
Vikram Melapudi, Chief AI Scientist, Intangles, said, “Schools and safety officers need greater visibility into real world driving behaviour so they can identify recurring risks, address unsafe practices and strengthen driver accountability. The focus must shift from simply checking whether a bus is compliant to continuously assessing how safely it is being operated.”
The findings come at a time when school transportation safety requirements are evolving. Maharashtra's July 2026 rules introduce additional measures covering seat belts, CCTV, live video access, GPS tracking, panic buttons, digital attendance and state monitoring integration. At the national level, Advanced Driver Assistance Systems (ADAS) are also being phased into newly manufactured buses and trucks between 2026 and 2028. However, with existing vehicles continuing to operate across school transportation networks, the study highlights the importance of strengthening safety practices within existing fleets.
Intangles emphasises that driving behaviour monitoring, real world trip data, cameras and structured driver coaching can help schools and fleet operators identify unsafe driving patterns and implement corrective measures. Integrating these capabilities with existing safety requirements can help create greater accountability and improve visibility into everyday school transportation operations.
Methodology
The study analysed real world vehicle data from 598 school buses operating across 61 Indian cities during January to July 2026, covering a reported six-month analysis period. Using its proprietary platform and algorithms, Intangles examined over 75,000 flagged driving events across four key parameters: speeding, hard braking, harsh acceleration and coasting (driving in neutral or with the engine switched off). The analysis assessed the frequency, timing and geographical distribution of these events to identify driving behaviour patterns. It also compared the proportion of safety events and alerts recorded in school buses with those in city buses. The findings are based on the vehicles analysed and reflect driving behaviour observed within the study sample.